2 Income and Expenditure
2.1 Annual income
The annual income for Univ. PT Mains was 3,060,000 yen, 3,160,000 yen for Other PT Mains, 8,720,000 yen for Univ. FT Mains, 7,680,000 yen for Other FT Mains, and 4,280,000 for Pension Mains. The average - 2,870,000 yen - for Univ. PT Mains has increased since the last survey, but 44% of Univ. PT Mains and 45% of Other PT Mains are earning under 2,500,000 yen and the majority is on low incomes; under 2,500,000 yen, with the average increasing because of more respondents answering 'Over 5,000,000 yen'.
91% of Univ. PT Mains' total income was earned through part-time university work, along with 29% of Other PT Mains, 9% of Univ. FT Mains and Other FT Mains, and 21% of Pension Mains.
Chart 13 Annual income (Q 2.1) Unit:per
| | Univ. PTmain | Other PTmain | Univ. FTmain | Other FTmain | Pension main | Total
| | Less than 250,000 yen | 5 | (1%) | 2 | (1%) | 0 | (0%) | 0 | (0%) | 0 | (0%) | 7 | (1%)
| | Less than 500,000 yen | 6 | (1%) | 3 | (2%) | 0 | (0%) | 0 | (0%) | 0 | (0%) | 9 | (1%)
| | Less than 750,000 yen | 15 | (3%) | 4 | (3%) | 0 | (0%) | 0 | (0%) | 0 | (0%) | 19 | (2%)
| | Less than 1,000,000 yen | 21 | (4%) | 10 | (7%) | 0 | (0%) | 0 | (0%) | 0 | (0%) | 31 | (3%)
| | Less than 1,250,000 yen | 29 | (5%) | 9 | (7%) | 0 | (0%) | 0 | (0%) | 0 | (0%) | 38 | (4%)
| | Less than 1,500,000 yen | 36 | (6%) | 8 | (6%) | 0 | (0%) | 0 | (0%) | 0 | (0%) | 44 | (5%)
| | Less than 1,750,000 yen | 26 | (5%) | 5 | (4%) | 0 | (0%) | 0 | (0%) | 0 | (0%) | 31 | (3%)
| | Less than 2,000,000 yen | 35 | (6%) | 12 | (9%) | 0 | (0%) | 1 | (1%) | 0 | (0%) | 48 | (5%)
| | Less than 2,250,000 yen | 38 | (7%) | 3 | (2%) | 0 | (0%) | 0 | (0%) | 1 | (2%) | 42 | (4%)
| | Less than 2,500,000 yen | 41 | (7%) | 6 | (4%) | 0 | (0%) | 4 | (5%) | 0 | (0%) | 51 | (5%)
| | Less than 2,750,000 yen | 15 | (3%) | 5 | (4%) | 0 | (0%) | 1 | (1%) | 1 | (2%) | 22 | (2%)
| | Less than 3,000,000 yen | 36 | (6%) | 9 | (7%) | 2 | (2%) | 3 | (4%) | 4 | (8%) | 54 | (6%)
| | Less than 3,250,000 yen | 30 | (5%) | 4 | (3%) | 0 | (0%) | 1 | (1%) | 1 | (2%) | 36 | (4%)
| | Less than 3,500,000 yen | 32 | (6%) | 5 | (4%) | 0 | (0%) | 3 | (4%) | 8 | (16%) | 48 | (5%)
| | Less than 3,750,000 yen | 54 | (9%) | 11 | (8%) | 3 | (3%) | 2 | (2%) | 3 | (6%) | 73 | (8%)
| | Less than 4,000,000 yen | 45 | (8%) | 7 | (5%) | 5 | (4%) | 3 | (4%) | 14 | (27%) | 74 | (8%) |
| Less than 5,000,000 yen | 33 | (6%) | 10 | (7%) | 4 | (4%) | 8 | (10%) | 7 | (14%) | 62 | (6%) |
| Less than 6,000,000 yen | 31 | (5%) | 12 | (9%) | 8 | (7%) | 6 | (7%) | 6 | (12%) | 63 | (7%) |
| Less than 7,000,000 yen | 23 | (4%) | 7 | (5%) | 13 | (11%) | 7 | (8%) | 4 | (8%) | 54 | (6%)
| | Less than 8,000,000 yen | 16 | (3%) | 1 | (1%) | 16 | (14%) | 11 | (13%) | 1 | (2%) | 45 | (5%) |
| Less than 10,000,000 yen | 4 | (1%) | 4 | (3%) | 21 | (18%) | 14 | (17%) | 1 | (2%) | 44 | (5%) |
| Less than 12,000,000 yen | 1 | (0%) | 0 | (0%) | 29 | (25%) | 7 | (8%) | 0 | (0%) | 37 | (4%)
| | Less than 14,000,000 yen | 0 | (0%) | 0 | (0%) | 7 | (6%) | 5 | (6%) | 0 | (0%) | 12 | (1%)
| | Less than 15,000,000 yen | 0 | (0%) | 0 | (0%) | 2 | (2%) | 2 | (2%) | 0 | (0%) | 4 | (0%) |
| Over 15,000,000 yen | 0 | (0%) | 1 | (10%) | 4 | (4%) | 6 | (7%) | 0 | (0%) | 11 | (1%) | <
| Not sure | 3 | | 0 | | 0 | | 1 | | 0 | | 4 | |
| Total | 572 | (100%) | 138 | (100%) | 114 | (0%) | 84 | (100%) | 51 | (100%) | 959 | (100%) |
| Average | 3,060,000 yen | 3,160,000 yen | 8,720,000 yen | 7,680,000 yen | 4,280,000 yen | 4,220,000 yen |
|
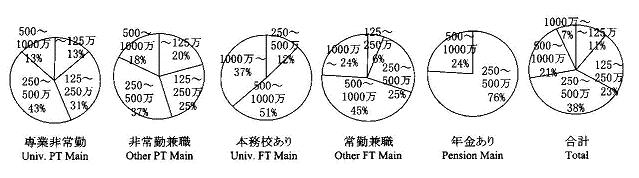
Chart 14 Annual income earned through part-time university (Q 2.2) Unit:per
| | Univ. PTmain | Other PTmain | Univ. FTmain | Other FTmain | Pension main | Total
| | Less than 250,000 yen | 4 | (1%) | 18 | (13%) | 14 | (13%) | 10 | (12%) | 3 | (6%) | 49 | (5%)
| | Less than 500,000 yen | 9 | (21%) | 27 | (19%) | 24 | (21%) | 28 | (33%) | 13 | (25%) | 101 | (10%)
| | Less than 750,000 yen | 24 | (4%) | 22 | (16%) | 26 | (23%) | 23 | (27%) | 11 | (21%) | 106 | (11%)
| | Less than 1,000,000 yen | 27 | (5%) | 23 | (16%) | 18 | (16%) | 8 | (9%) | 6 | (12%) | 82 | (8%)
| | Less than 1,250,000 yen | 42 | (7%) | 16 | (11%) | 9 | (8%) | 6 | (7%) | 4 | (8%) | 77 | (8%)
| | Less than 1,500,000 yen | 36 | (6%) | 9 | (6%) | 0 | (0%) | 2 | (2%) | 7 | (13%) | 65 | (7%)
| | Less than 1,750,000 yen | 26 | (4%) | 7 | (5%) | 2 | (2%) | 1 | (1%) | 3 | (6%) | 39 | (4%)
| | Less than 2,000,000 yen | 41 | (7%) | 8 | (6%) | 2 | (2%) | 4 | (5%) | 3 | (6%) | 58 | (6%)
| | Less than 2,250,000 yen | 46 | (8%) | 3 | (2%) | 0 | (0%) | 1 | (1%) | 1 | (2%) | 51 | (5%)
| | Less than 2,500,000 yen | 31 | (3%) | 5 | (4%) | 3 | (3%) | 0 | (0%) | 0 | (0%) | 39 | (4%)
| | Less than 2,750,000 yen | 22 | (4%) | 1 | (1%) | 1 | (1%) | 1 | (1%) | 0 | (0%) | 25 | (3%)
| | Less than 3,000,000 yen | 39 | (7%) | 1 | (1%) | 0 | (0%) | 0 | (0%) | 0 | (0%) | 40 | (4%)
| | Less than 3,250,000 yen | 37 | (6%) | 0 | (0%) | 0 | (0%) | 0 | (0%) | 0 | (0%) | 37 | (4%)
| | Less than 3,500,000 yen | 30 | (5%) | 0 | (0%) | 0 | (0%) | 0 | (0%) | 1 | (2%) | 31 | (3%)
| | Less than 3,750,000 yen | 48 | (8%) | 1 | (1%) | 2 | (2%) | 1 | (1%) | 0 | (0%) | 52 | (5%)
| | Less than 4,000,000 yen | 34 | (6%) | 0 | (0%) | 0 | (0%) | 0 | (0%) | 0 | (0%) | 34 | (3%) |
| Less than 5,000,000 yen | 30 | (5%) | 0 | (0%) | 0 | (0%) | 0 | (0%) | 0 | (0%) | 30 | (3%) |
| Less than 6,000,000 yen | 25 | (4%) | 0 | (0%) | 0 | (0%) | 0 | (0%) | 0 | (0%) | 25 | (3%) |
| Less than 7,000,000 yen | 17 | (3%) | 0 | (0%) | 0 | (0%) | 0 | (0%) | 0 | (0%) | 17 | (2%)
| | Less than 8,000,000 yen | 11 | (2%) | 0 | (0%) | 0 | (0%) | 0 | (0%) | 0 | (0%) | 11 | (1%) |
| Over 8,000,000 yen | 3 | (1%) | 0 | (0%) | 0 | (0%) | 0 | (0%) | 0 | (0%) | 3 | (0%) |
| Not sure | 3 | | 0 | | 0 | | 0 | | 0 | | 3 | |
| Total | 582 | (100%) | 141 | (100%) | 112 | (0%) | 85 | (100%) | 52 | (100%) | 972 | (100%) |
| Average | 2,770,000 yen | 920,000 yen | 820,000 yen | 710,000 yen | 910,000 yen | 2,000,000 yen |
| Percentage | 91% | 29% | 9% | 9% | 21% | 47% |
|
2.2 Expenses related to lessons and research
Average costs for Univ. PT Mains for lessons and related research was 270,000 yen, for Other PT Mains 370,000 yen; for Univ. FT Mains 740,000; for Other FT Mains 270,000 yen; and for Pension Mains 260,000 yen.
Apart from in the case of the Univ. FT Mains, either these costs were totally unreimbursed or else only to a small degree. With Univ. FT Mains, an average of 396,000 yen was reimbursed.
Chart 15 Teaching and Research-Related Expenditure (Q 2.4.1) Unite:per
| | Univ. PTmain | Other PTmain | Univ. FTmain | Other FTmain | Pension main | Total
| | 0 | 16 | (3%) | 4 | (3%) | 1 | (1%) | 4 | (5%) | 1 | (2%) | 26 | (3%)
| | Less than 10,000 yen | 18 | (3%) | 3 | (2%) | 0 | (0%) | 4 | (5%) | 4 | (8%) | 29 | (3%)
| | Less than 50,000 yen | 62 | (11%) | 24 | (19%) | 10 | (9%) | 20 | (23%) | 6 | (12%) | 122 | (13%)
| | Less than 100,000 yen | 91 | (16%) | 15 | (12%) | 5 | (4%) | 18 | (21%) | 8 | (15%) | 137 | (15%)
| | Less than 200,000 yen | 117 | (21%) | 16 | (12%) | 12 | (10%) | 11 | (13%) | 9 | (17%) | 165 | (18%)
| | Less than 300,000 yen | 90 | (16%) | 17 | (13%) | 10 | (9%) | 6 | (7%) | 10 | (19%) | 133 | (14%)
| | Less than 400,000 yen | 34 | (6%) | 9 | (7%) | 5 | (4%) | 1 | (1%) | 4 | (8%) | 53 | (6%)
| | Less than 500,000 yen | 43 | (8%) | 12 | (9%) | 18 | (15%) | 8 | (9%) | 5 | (10%) | 86 | (9%)
| | Less than 600,000 yen | 24 | (4%) | 5 | (4%) | 5 | (4%) | 3 | (3%) | 1 | (2%) | 38 | (4%)
| | Less than 700,000 yen | 13 | (2%) | 1 | (1%) | 4 | (3%) | 1 | (1%) | 1 | (2%) | 20 | (2%)
| | Less than 800,000 yen | 12 | (2%) | 2 | (2%) | 9 | (8%) | 1 | (1%) | 2 | (4%) | 26 | (3%)
| | Less than 900,000 yen | 3 | (1%) | 0 | (0%) | 2 | (2%) | 0 | (0%) | 0 | (0%) | 5 | (1%)
| | Less than 1,000,000 yen | 22 | (4%) | 11 | (9%) | 11 | (9%) | 5 | (6%) | 0 | (0%) | 49 | (5%)
| | Less than 1,500,000 yen | 7 | (1%) | 7 | (5%) | 10 | (9%) | 2 | (2%) | 0 | (0%) | 26 | (3%)
| | Less than 2,000,000 yen | 3 | (1%) | 1 | (1%) | 3 | (3%) | 1 | (1%) | 0 | (0%) | 8 | (1%)
| | Over 2,000,000 yen | 1 | (0%) | 2 | (2%) | 12 | (10%) | 1 | (1%) | 1 | (2%) | 17 | (2%) |
| Not sure | 30 | | 6 | | 4 | | 3 | | 1 | | 44 | |
| Total | 556 | (100%) | 129 | (100%) | 117 | (0%) | 86 | (100%) | 52 | (100%) | 940 | (100%) |
| Average | 270,000 yen | 370,000 yen | 740,000 yen | 270,000 yen | 260,000 yen | 340,000 yen |
|
Chart 16 How much was covered by the university (Q 2.4.1) Unite:per
| | Univ. PTmain | Other PTmain | Univ. FTmain | Other FTmain | Pension main | Total
| | 0 | 485 | (84%) | 95 | (70%) | 13 | (11%) | 64 | (75%) | 44 | (85%) | 701 | (72%)
| | Less than 10,000 yen | 39 | (7%) | 13 | (10%) | 4 | (3%) | 5 | (6%) | 3 | (6%) | 64 | (7%)
| | Less than 50,000 yen | 25 | (4%) | 7 | (5%) | 6 | (5%) | 7 | (8%) | 2 | (4%) | 47 | (5%)
| | Less than 100,000 yen | 11 | (2%) | 5 | (4%) | 7 | (6%) | 1 | (1%) | 1 | (2%) | 25 | (3%)
| | Less than 200,000 yen | 10 | (2%) | 3 | (2%) | 11 | (9%) | 2 | (2%) | 1 | (2%) | 27 | (3%)
| | Less than 300,000 yen | 2 | (0%) | 2 | (1%) | 19 | (16%) | 2 | (2%) | 0 | (0%) | 25 | (3%)
| | Less than 400,000 yen | 1 | (0%) | 3 | (2%) | 19 | (16%) | 1 | (1%) | 1 | (2%) | 25 | (3%)
| | Less than 500,000 yen | 1 | (0%) | 3 | (2%) | 13 | (11%) | 0 | (0%) | 0 | (0%) | 17 | (2%)
| | Less than 600,000 yen | 1 | (0%) | 0 | (0%) | 5 | (4%) | 1 | (1%) | 0 | (0%) | 7 | (1%)
| | Less than 700,000 yen | 1 | (0%) | 1 | (1%) | 3 | (3%) | 1 | (1%) | 0 | (0%) | 6 | (1%)
| | Less than 800,000 yen | 1 | (0%) | 0 | (0%) | 5 | (4%) | 0 | (0%) | 0 | (0%) | 6 | (1%)
| | Less than 900,000 yen | 1 | (0%) | 0 | (0%) | 4 | (3%) | 0 | (0%) | 0 | (0%) | 5 | (1%)
| | Less than 1,000,000 yen | 1 | (0%) | 0 | (0%) | 3 | (3%) | 1 | (1%) | 0 | (0%) | 5 | (1%)
| | Less than 1,500,000 yen | 0 | (0%) | 3 | (2%) | 3 | (3%) | 0 | (0%) | 0 | (0%) | 6 | (1%)
| | Less than 2,000,000 yen | 0 | (0%) | 0 | (0%) | 4 | (3%) | 0 | (0%) | 0 | (0%) | 4 | (0%)
| | Over 2,000,000 yen | 0 | (0%) | 0 | (0%) | 1 | (1%) | 0 | (0%) | 0 | (0%) | 1 | (0%) |
| Not sure | 4 | | 3 | | 0 | | 2 | | 0 | | 9 | |
| Total | 579 | (100%) | 135 | (100%) | 120 | (0%) | 85 | (100%) | 52 | (100%) | 971 | (100%) |
| Average | 14,000 yen | 62,000 yen | 396,000 yen | 42,000 yen | 13,000 yen | 71,000 yen |
|
Profile & Index
How
1 Makeup
2 Income & Expenditure
3 Work style
4 Social Insurance
5 General
6 Free Comments
Appendix