1 Makeup of the Respondents
1.1 Categorization and Definitions of University Teaching Staff
University teachers can broadly be divided into two categories: full-time and part-time. Part-time teachers are called 'Hijokin Koshi', come to the university just for the lesson time, and are workers on one-year or six-month contracts. University teachers have typically been of these two types, but nowadays the number of job categories in between is increasing.
Even within the category of part-time, there are various kinds. For the purposes of this report, we have divided them into five types:
1. University Part-time Main (Univ. PT Main): Mainly working in universities as part-timers
2. Other Part-time Main (Other PT Main): Mainly doing other part-time jobs
3. University Full-time Main (Univ. FT Main): Teachers working at another university full-time
4. Other Full-time Main (Other FT Main): Doing a full-time job other than university teaching
5. Pension Main: People with income from a pension
We decided on the categories by asking the source of 50% or over of respondents' income in question 2.3 of the survey, but we adjusted the categories when we found contradictions when comparing with other items in the responses.
50% or over under 'Other' gave 'Accountant', 'Private Lessons', 'Curator', 'Part-time researcher' , 'Authorship royalties' , 'Musical activities' , 'Post-doc income, 'Scholarship', 'Allowance', etc. We allocated these to the above categories in the closest way we could.
1.2 Sex
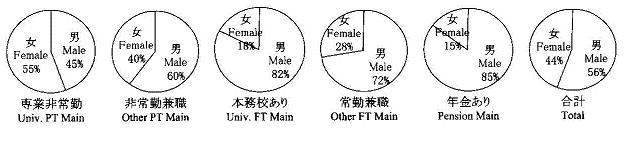
Males were in the overwhelming majority among Univ. FT Mains and Pension Mains, at 82% and 85% respec-tively, but among Other FT Mains were somewhat fewer at 72%, among Other PT Mains, 60%, and among Univ. PT Mains, females were in a majority at 55%.
Chart 1 Sex (Q1.1) Unit:per
| | Univ. PTmain | Other PTmain | Univ. FTmain | Other FTmain | Pension main | Total
| | Male | 266 | (45%) | 86 | (60%) | 102 | (82%) | 65 | (72%) | 46 | (85%) | 565 | (56%)
| | Female | 329 | (55%) | 57 | (40%) | 22 | (18%) | 25 | (28%) | 8 | (15%) | 441 | (46%)
| | Total | 595 | (100%) | 143 | (100%) | 124 | (100%) | 90 | (100%) | 54 | (100%) | 1006 | (100%)
| |
1.3 Nationality
Nationalities other than Japanese have broadly increased by 5% over the last figures (24% of Univ. PT Mains, 35% of Univ. FT Mains; in all 21% held foreign nationality).
We think this reflects the fact that we have started making an English version of this questionnaire.
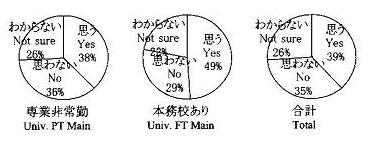
As for the broad geographical location of the foreign respondents' nationalities, 44% were from North America and 31% from Europe. In reply to the question 'Do you think you are discriminated against because you are a foreign national?', 38% of Univ. PT Main teachers and 49% of Univ. FT Main teachers answered 'Yes'. 'No'answers came from 36% of Univ. PT Main teachers and 29% of Univ. FT Main teachers, so the figures are roughly even, but among the Univ. FT Main teachers the 'Yes' answers were 20% higher than the 'No'.
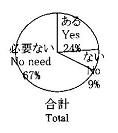
In reply to the question, 'Does the university where you work part-time help you obtain a visa?' 67% of all re-spondents answered 'No need', while 9% answered 'No'.
Chart 2 Naitonality (Q1.2) Unit: per
| | Univ. PTmain | Other PTmain | Univ. FTmain | Other FTmain | Pension main | Total
| | Japanese | 453 | (76%) | 124 | (88%) | 81 | (65%) | 8365 | (91%) | 54 | (100%) | 795 | (79%)
| | Not Japanese | 141 | (24%) | 17 | (12%) | 43 | (35%) | 8 | (9%) | 0 | (0%) | 209 | (21%)
| | Total | 594 | (100%) | 141 | (100%) | 124 | (100%) | 91 | (100%) | 54 | (100%) | 1004 | (100%)
| |
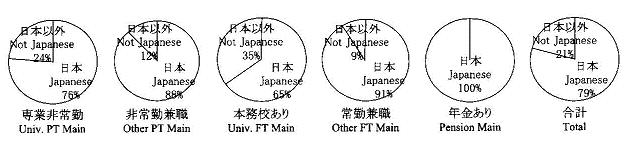
Chart 3 Region where you have nationality (Q1.2.1) Unit: per
| | Univ. PTmain | Other PTmain | Univ. FTmain | Other FTmain | Pension main | Total
| | Asia | 30 | (21%) | 3 | (18%) | 2 | (5%) | 1 | (13%) | 0 | (0%) | 36 | (17%)
| | N America | 56 | (40%) | 11 | (65%) | 21 | (49%) | 3 | (38%) | 0 | (0%) | 91 | (44%)
| | S/C America | 1 | (1%) | 0 | (0%) | 0 | (0%) | 0 | (0%) | 0 | (0%) | 1 | (0%)
| | Europe | 41 | (29%) | 3 | (18%) | 17 | (40%) | 3 | (38%) | 0 | (0%) | 64 | (31%)
| | Oceania | 12 | (9%) | 0 | (0%) | 3 | (7%) | 1 | (13%) | 0 | (0%) | 16 | (8%)
| | Total | 140 | (100%) | 17 | (100%) | 43 | (100%) | 8 | (100%) | 0 | (0%) | 208 | (100%)
| |
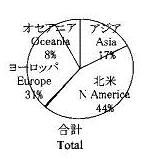
Chart 4 Do you think you are discriminated against because you are not a Japanese citizen? (Q1.3) Unit: per
| | Univ. PTmain | Other PTmain | Univ. FTmain | Other FTmain | Pension main | Total
| | Yes | 52 | (38%) | 4 | (25%) | 20 | (49%) | 2 | (25%) | 0 | (0%) | 78 | (39%)
| | Noü@ | 50 | (36%) | 8 | (50%) | 12 | (29%) | 1 | (13%) | 0 | (0%) | 71 | (35%)
| | Not sure | 35 | (26%) | 4 | (25%) | 9 | (22%) | 5 | (63%) | 0 | (0%) | 53 | (26%)
| | Total | 137 | (100%) | 16 | (100%) | 41 | (100%) | 8 | (100%) | 0 | (0%) | 202 | (100%)
| |
Char 5 Does the university where you work part-time help you obtain a visa? (Q1.4) Unit:per
| | Univ. PTmain | Other PTmain | Univ. FTmain | Other FTmain | Pension main | Total
| | Yes | 40 | (31%) | 3 | (19%) | 3 | (8%) | 0 | (0%) | 0 | (0%) | 46 | (24%)
| | Noü@ | 12 | (9%) | 3 | (19%) | 3 | (8%) | 0 | (0%) | 0 | (0%) | 18 | (9%)
| | No need | 77 | (60%) | 10 | (63%) | 34 | (85%) | 8 | (100%) | 0 | (0%) | 129 | (67%)
| | Total | 129 | (100%) | 16 | (100%) | 40 | (100%) | 8 | (100%) | 0 | (0%) | 193 | (100%)
| |
1.4 Mother Tongue
78% of respondents said that their native tongue was Japanese, 21% said 'Other than Japanese', and 1% said 'Bilingual'. Of the 'Other than Japanese' respondents, 69% said English, 12% Chinese, and 10% French.
In reply to the question 'Are contracts, etc. written in a language you comprehend? 41% replied 'Little' or 'None', and many teachers replied that their contracts, etc. were not drawn up in languages they could understand.
Chart 6 Mother Tongue (Q1.5) Unit:per
| | Univ. PTmain | Other PTmain | Univ. FTmain | Other FTmain | Pension main | Total
| | Japanese | 408 | (74%) | 113 | (88%) | 77 | (65%) | 73 | (90%) | 48 | (100%) | 719 | (78%)
| | Not Japaneseü@ | 136 | (25%) | 14 | (11%) | 40 | (34%) | 7 | (9%) | 0 | (0%) | 197 | (21%)
| | Bilingual | 6 | (1%) | 1 | (1%) | 1 | (1%) | 1 | (1%) | 0 | (0%) | 9 | (1%)
| | Total | 550 | (100%) | 128 | (100%) | 118 | (100%) | 81 | (100%) | 48 | (100%) | 925 | (100%)
| |
Chart 7 What is your naive tongue? (Q1.5.1) Unit:per
| | Total |
| English | 138 | (69%) |
| French | 20 | (10%) |
| German | 13 | (6%) |
| Spanish | 7 | (3%) |
| Russian | 2 | 1(%) |
| Chinese | 24 | (12%) |
| Korean | 5 | (2%) |
| Other | 9 | (4%) |
| Total | 218 | (108%) |
| Total Respondents | 201 | (100%) |
|
Chart 8 Are written contracts etc. written in a language you comprehend? (Q1.6) Unit:per
| | Univ. PTmain | Other PTmain | Univ. FTmain | Other FTmain | Pension main | Total
| Understand
Japanese | 36 | (27%) | 4 | (27%) | 6 | (15%) | 2 | (29%) | 0 | (0%) | 48 | (24%)
| | All | 16 | (12%) | 1 | (7%) | 10 | (24%) | 0 | (0%) | 0 | (0%) | 27 | (14%)
| | Many | 28 | (21%) | 2 | (13%) | 10 | (24%) | 1 | (14%) | 0 | (0%) | 41 | (21%)
| | Few | 43 | (32%) | 2 | (13%) | 11 | (27%) | 0 | (0%) | 0 | (0%) | 56 | (28%)
| | None | 12 | (9%) | 6 | (40%) | 4 | (10%) | 4 | (57%) | 0 | (0%) | 26 | (13%)
| | Total | 135 | (100%) | 15 | (100%) | 41 | (100%) | 7 | (100%) | 0 | (0%) | 198 | (100%)
| |
1.5 Age
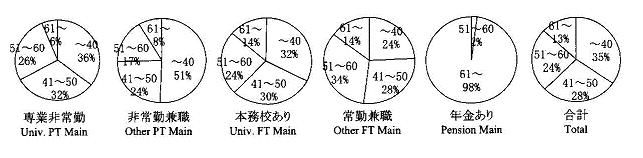
There were basically no differences in the average age of Univ. PT Main teachers (45.3) and that of Univ. FT Main teachers (47.2), and their breakdown was also more or less the same. Almost half of the Other FT Mains are 51 or over, and the average age, too, has gone up a little to 49.4.
On the other hand, the majority of Other PT Mains was under 40 years old, and the average was 43.1. Of the Pension Mains, most were over 61.
Chart 9 Age (Q1.7) Unit:per
| | Univ. PTmain | Other PTmain | Univ. FTmain | Other FTmain | Pension main | Total
| | Below 30 | 19 | (3%) | 16 | (11%) | 2 | (2%) | 2 | (2%) | 0 | (0%) | 39 | (4%) |
| 31ü`35 | 92 | (15%) | 26 | (18%) | 15 | (12%) | 9 | (10%) | 0 | (0%) | 142 | (14%) |
| 36ü`40 | 101 | (17%) | 30 | (21%) | 23 | (19%) | 11 | (12%) | 0 | (0%) | 165 | (16%) |
| 41ü`45 | 110 | (18%) | 17 | (12%) | 20 | (16%) | 10 | (11%) | 0 | (0%) | 157 | (16%) |
| 46ü`50 | 79 | (13%) | 17 | (12%) | 17 | (14%) | 15 | (17%) | 0 | (0%) | 128 | (13%) |
| 51ü`55 | 95 | (16%) | 14 | (10%) | 16 | (13%) | 13 | (14%) | 1 | (2%) | 139 | (14%) |
| 56ü`60 | 62 | (10%) | 10 | (7%) | 13 | (11%) | 17 | (19%) | 0 | (0%) | 102 | (10%) |
| 61ü`65 | 30 | (5%) | 5 | (4%) | 11 | (9%) | 8 | (9%) | 20 | (37%) | 74 | (7%) |
| 66ü`70 | 6 | (1%) | 5 | (4%) | 6 | (5%) | 4 | (4%) | 24 | (44%) | 45 | (4%) |
| 71ü`75 | 0 | (0%) | 2 | (1%) | 0 | (0%) | 1 | (1%) | 8 | (15%) | 11 | (1%) |
| Over 76 | 1 | (0%) | 0 | (0%) | 0 | (0%) | 0 | (0%) | 1 | (2%) | 2 | (0%) |
| Total | 595 | (100%) | 142 | (100%) | 123 | (100%) | 90 | (100%) | 54 | (0%) | 1004 | (0%) |
| Average (years) | 45.3 | 43.1 | 47.2 | 49.4 | 66.8 | 46.7
| |
1.6 Region
476 (48%) live in the Kanto region, and 404 (41%) in the Kansai, and both groups together constituted 89% of the total, but in comparison with the last survey, the number of respondents from outside Kanto and Kanto has in-creased (last time 96.5% were from these regions).
The reason that respondents are preponderantly from Kanto and Kansai is thought to be that the unions asked to help with this survey are based in these regions.
Chart 10 Region (Q1.8.1-2) Unit:per
| | Living Area | | Working Area |
| | Hokkaido | 11 | (1%) | | | 11 | (1%) | |
| | Aomori | 3 | (0%) | | | 3 | (0%) | |
| | Miyagi | 2 | (0%) | | | 3 | (0%) | |
| | Yamagata | | | | | 1 | (0%) | |
| | Fukusima | 1 | (0%) | | | 3 | (0%) | |
| | Ibaragi | 12 | (1%) | | | 13 | (1%) | |
| | Tochigi | 5 | (1%) | | | 10 | (1%) | |
| | Gunma | 1 | (0%) | Total of | Kanto Area | 4 | (0%) | Total of | Kanto Area
| | Saitama | 45 | (5%) | 476 | (48%) | 136 | (14%) | 772 | (48%)
| | Chiba | 50 | (5%) | | | 73 | (7%) | |
| | Tokyo | 271 | (27%) | | | 395 | (40%) | |
| | Kanagawa | 92 | (9%) | | | 141 | (14%) | |
| | Niigata | 1 | (0%) | | | 3 | (0%) | |
| | Toyama | 2 | (0%) | | | 2 | (0%) | |
| | Ishikawa | 1 | (0%) | | | 1 | (0%) | |
| | Fukui | 1 | (0%) | | | 1 | (0%) | |
| | Yamanashi | 1 | (0%) | | | 14 | (1%) | |
| | Nagano | 4 | (0%) | | | 2 | (0%) | |
| | Gifu | 3 | (0%) | | | 3 | (0%) | |
| | Shizuoka | 2 | (0%) | | | 5 | (1%) | |
| | Aichi | 8 | (1%) | | | 15 | (2%) | |
| | Mie | | | | | 6 | (1%) | |
| | Shiga | 17 | (2%) | | | 45 | (5%) | |
| | Kyoto | 104 | (10%) | Total of | Kansai Area | 174 | (18%) | Total of | Kansai Area
| | Osaka | 159 | (16%) | 404 | (41%) | 248 | (25%) | 680 | (42%)
| | Hyogo | 94 | (9%) | | | 158 | (16%) | |
| | Nara | 28 | (3%) | | | 44 | (4%) | |
| | Wakayama | 2 | (0%) | | | 5 | (1%) | |
| | Tottori | | | | | 2 | (0%) | |
| | Shimane | | | | | 1 | (0%) | |
| | Okayama | | | | | 3 | (0%) | |
| | Hiroshima | 7 | (1%) | | | 6 | (1%) | |
| | Yamaguchi | 3 | (0%) | | | 6 | (1%) | |
| | Kagawa | 1 | (0%) | | | | | |
| | Ehime | 8 | (1%) | | | 11 | (1%) | |
| | Fukuoka | 44 | (4%) | | | 48 | (5%) | |
| | Saga | 2 | (0%) | | | 2 | (0%) | |
| | Nagasaki | | | | | 2 | (0%) | |
| | Kumamoto | 2 | (0%) | | | 4 | (0%) | |
| | Oita | 4 | (0%) | | | 3 | (0%) | |
| | Kagoshima | 2 | (0%) | | | 2 | (0%) | |
| | Okinawa | | | | | 1 | (0%) | |
| | Total | 993 | (100%) | | | 1610 | (163%) | |
| | Total Respondents | | | | | 988 | (100%) | |
| |
1.7 Households
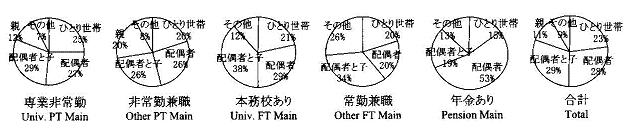
Regarding the composition of households, a lot of replies in every category gave 'Spouse and child(ren)', 'Spouse' and 'Single'. Other than this, there were a lot of replies of 'Parent' among Univ. PT Main and Other PT Main, and 'Spouse and child(ren) and parent' among Other FT Mains.
In the 'Other' category, there were many responses of 'Sibling(s)' or 'Cousin(s)'. Also, we counted unmarried cohabiting respondents as 'Spouse'.
30% of Univ. PT Mains had one or more dependents, along with 35% of Other PT Mains, 35% of Univ. FT Mains, 62% of Other FT Mains, 60% of Pension Mains, and 39% overall.
Chart 11 Member of your household (Q1.9) Unit:per
| | Univ. PTmain | Other PTmain | Univ. FTmain | Other FTmain | Pension main | Total
| | Single | 147 | (25%) | 28 | (20%) | 26 | (21%) | 18 | (20%) | 8 | (15%) | 227 | (23%)
| | Spouse | 158 | (27%) | 38 | (27%) | 35 | (29%) | 18 | (20%) | 29 | (54%) | 278 | (28%)
| Spouse and
child(ren) | 175 | (30%) | 37 | (26%) | 46 | (38%) | 31 | (34%) | 10 | (19%) | 299 | (30%)
| | Parent | 68 | (12%) | 28 | (20%) | 5 | (4%) | 6 | (7%) | 1 | (2%) | 108 | (11%)
| | Child(ren) | 13 | (2%) | 3 | (2%) | 1 | (1%) | 2 | (2%) | 0 | (0%) | 19 | (2%)
| Spouse and
parent | 8 | (1%) | 0 | (0%) | 2 | (2%) | 3 | (3%) | 1 | (2%) | 14 | (1%)
| Spouse, child(ren)
and parent | 14 | (2%) | 3 | (2%) | 4 | (3%) | 12 | (13%) | 2 | (4%) | 35 | (4%)
| | Other | 7 | (1%) | 5 | (4%) | 2 | (2%) | 1 | (1%) | 3 | (6%) | 18 | (2%)
| | Total | 590 | (100%) | 142 | (100%) | 121 | (100%) | 91 | (100%) | 54 | (0%) | 998 | (100%)
| |
Chat 12 Number of your dependents (Q1.10) Unit:per
| | Univ. PTmain | Other PTmain | Univ. FTmain | Other FTmain | Pension main | Total
| | 0 person | 409 | (70%) | 93 | (65%) | 46 | (38%) | 35 | (38%) | 21 | (40%) | 604 | (61%)
| | 1 person | 74 | (13%) | 20 | (14%) | 33 | (27%) | 19 | (21%) | 25 | (47%) | 171 | (17%)
| | 2 people | 56 | (10%) | 16 | (11%) | 25 | (21%) | 18 | (20%) | 4 | (8%) | 119 | (12%)
| | 3 people | 27 | (5%) | 9 | (6%) | 11 | (9%) | 14 | (15%) | 3 | (6%) | 64 | (6%)
| 4 people
or more | 19 | (3%) | 4 | (3%) | 6 | (5%) | 5 | (5%) | 0 | (0%) | 34 | (3%)
| | Total | 585 | (100%) | 142 | (100%) | 121 | (100%) | 91 | (100%) | 53 | (0%) | 992 | (100%)
| |
Profile & Index
How
1 Makeup
2 Income & Expenditure
3 Work style
4 Social Insurance
5 General
6 Free Comments
Appendix